When we visualize remote sensing data, whether multispectral or hyperspectral remote sensing, to create a wavelength-wise reflectance graph (Figure 1), we often use the terms “spectral response curve” and “spectral profile” interchangeably. However, they are not synonymous!
These two terms, (1) spectral response curve and (2) spectral profile have distinct meanings when it comes to representing wavelength-wise reflectance.
The textbook definition of a “spectral response curve” is as follows: it is a graph that shows reflectance or radiance as a function of wavelength. It represents the pure reflectance values of an object at every wavelength across a given region (for instance, the near-infrared region). Hyperspectral reflectance can be an ideal example in this regard, as it contains finer spectral information. In other words, it measures reflectance at every wavelength within a given region (Figure 1).
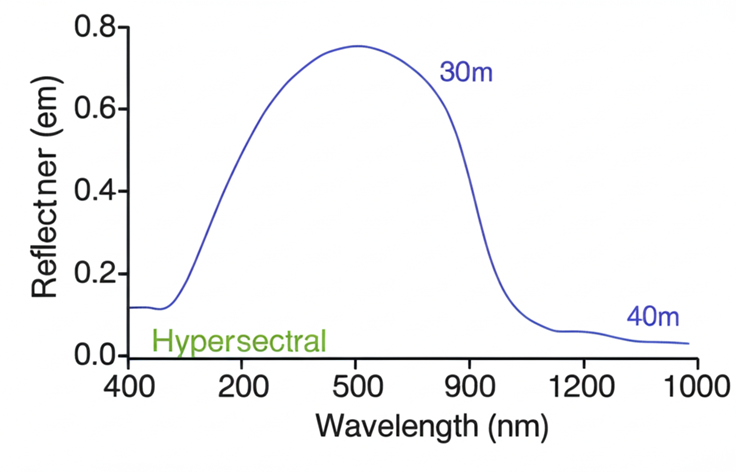
Figure 1: Spectral response graph
The textbook definition of a “spectral profile” is: it is a graph that shows pixel values as a function of bands. It is more specific to remote sensing imagery (i.e., a multispectral image), the wavelength-wise reflectance graph of which gives us the reflectance values of an object at specific bands (not reflectance measurements for every wavelength) (Figure 2).
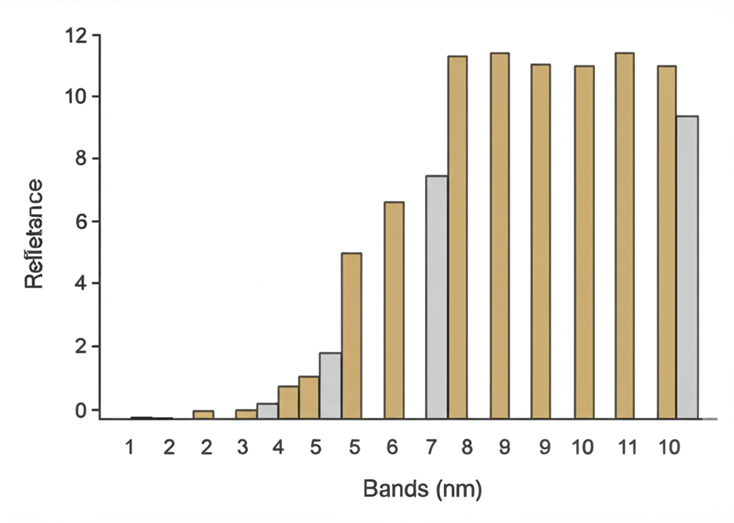
Figure 2: Spectral profile
In hyperspectral data, every wavelength is considered a single band (Figure 3), and when the corresponding reflectance of each of these bands is plotted on a graph like Figure 1, we get a spectral response curve. On the other hand, in multispectral data, the reflectance values that we see for each band (such as red, near-infrared), as shown in Figure 2, are average values for a given region, and such a graph is called a spectral profile.
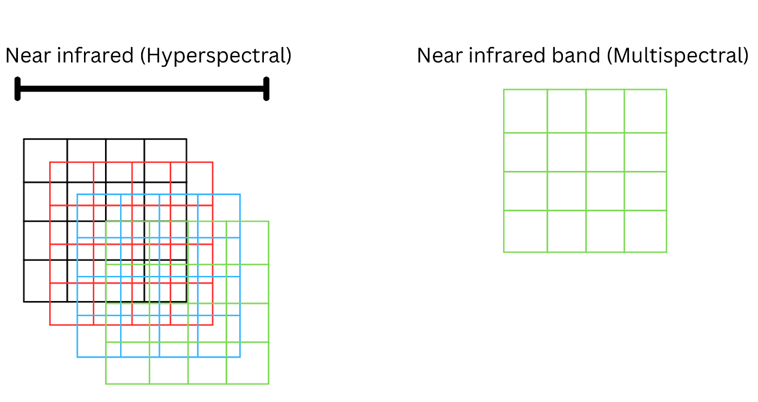
Figure 3: Hyperspectral vs multispectral data
Some useful resources that discuss that might be useful to understand this distinction:
- YouTube Videos (OneFourFourExplains)
- PlanetScope discussion
- Discussion on SRF

Leave a Reply